본지는 최근 DRJ(Disaster Recovery Journal)와 전략적 업무 제휴를 맺고 기사 제휴 및 정보 공유를 통해 선진재난을 구현하는 매체로 성장해 나가자는 데 합의했습니다. 이에 따라 재난포커스 기사가 DRJ에 실리게 되며 본지 3월호부터 DRJ 겨울특집기사를 시범적으로 선보입니다. 첫 소개인만큼 원문에 충실하기 위해 한글요약과 원문을 게재합니다.
과거와는 달리 기업이 직면하고 있는 리스크와 이해관계자의 범위 그리고 법적 책임 등이 크게 증대하고 있어 비즈니스연속성(Business Continuity, BC)과 재해복구(Disaster Recovery, DR; 번역자 주, BC에 비해 정보시스템(IT) 복구에 보다 중점을 둔 개념으로 볼 수 있음. 하지만 IT에 국한되지 않고 다루는 범위, 대상이 큰 경우도 많아 명확히 구분하기 어려운 경우도 많음)에 대한 준비는 기업의 규모와 상관없이 가장 중요한 경영활동 중 하나로 인식되고 있다.
실제로 이러한 체계의 도입 시점에서 해당 기업의 비즈니스연속성, 재해복구 관련된 성숙도 수준은 매우 다양하기 때문에 도입, 구현을 위한 적절한 예산확보 및 전사차원에서의 지원, 조직구성 등 풀어가야 할 많은 과제들에 직면하게 된다.
Due to increased competition, increased risk, and increased oversight and fiduciary responsibility, business continuity (BC) and disaster recovery (DR) preparedness is a critical priority at large and small companies alike. But getting started is difficult, and building the business case to obtain adequate funding is even more difficult - especially when companies are at various phases of BC and DR maturity.
본고에서는 DRJ와 포레스터 리서치(www.forrester.com, Gartner, IDC와 함께 세계적인 시장, 기술동향에 대한 조사기관 중 하나)가 2007년 10월 250명의 기업(지리적으로 국한되지 않았음)global BCP 담당자를 대상으로 설문을 통해 기업의 재해복구(DR) 관련한 준비상태, 현황 그리고 활동들에 대해서 조사하고 그 분석결과를 소개하고 있으며, 본 설문조사의 목적은 이러한 분석보고서를 통해 모범사례를 벤치마킹하고 기업에 구현 시 기준과 가이드라인으로 참고할 수 있도록 하기 위함이다.
Forrester Research and the Disaster Recovery Journal have partnered to field a number of market studies in business continuity and disaster recovery in order to gather data for company comparison and benchmarking and to guide research and publication of best practices and recommendations for the industry. This is the first study, and it’s focused on gathering a baseline of company DR preparedness.
특히 이 보고서에서는 재해복구에 대해서 기업이 얼마나 예산을 확보하고 집행하고 있는지, 재해복구계획수립, 유지관리, 테스트 등의 주요 활동은 어떻게 하고 있는지, 대체업무복구장소 (대체사업장)의 구축 관련 내용, 복구목표수준(RTO 등) 및 실제로 기업이 자신들의 재해복구 체계에 대해서 얼마나 확신하고 있는 지 등을 중점적으로 조사하였다.
Specifically, this study was designed to determine:
● How much companies are spending on DR.
● Company practices regarding DR planning, DR plan maintenance, and DR testing.
● The percentages of companies that have alternate recovery sites, the number of sites, and the distance between sites.
● Current recovery objectives and technology selection.
● Company confidence in DR preparations and preparedness.
● The most common causes of disaster declarations and downtime and the cost of downtime.
● Market drivers fueling continued improvement in DR preparedness.
조사방법은 2007년 10월 포레스터 리서치와 DRJ가 공동으로 온라인을 통해 250 DRJ 회원에 대해서 설문조사를 했으며, 이중 42% 이상이 5,000명 이상의 임직원이 종사하는 회사에 소속 되어 있으며, 실제로 재해복구 관련 담당자로 의사결정이 가능한 실무책임자 이상의 직급을 가지고 있었다.
Study Methodology
● In October 2007, Forrester Research and the Disaster Recovery Journal (DRJ) conducted on online survey of 250 DRJ members. In this survey:
● 33 percent of respondents were from companies that had 0 to 999 employees; 25 percent had 1,000 to 4,990 employees; 20 percent had 5,000 to 19,999 employees; and 22 percent had 20,000 or more employees.
● 36 percent of respondents were from companies with revenues of less than $500 million; 10 percent were from companies with revenues of $500 million to $999 million; 19 percent were from companies with revenues of $1 billion to $4.99 billion; 8 percent were from companies with revenues of $5 billion to $10 billion; and 15 percent were from companies with revenues of more than $10 billion.
● All respondents were decision-makers or influencer in regards to planning and purchasing technology and services related to disaster recovery.
● Respondents were from a variety of industries.
조사 대상은 무작위로 선정된 것이 아니고, 대부분 일정수준과 경험, 역량을 겸비한 BCP 분야의 현업실무자로 여러 전문가모임과 업계, 기술동향에 적극적으로 참여하고 있는 DRJ 회원을 대상으로 하여 설문조사를 한 것으로 분석결과는 무작위로 설문대상을 선정하는 것 보다 충실한 것으로 보고 있다.
This survey used a self-selected group of respondents (DRJ members) and is therefore not random. These respondents are more sophisticated than the average. They read and participate in business continuity (BC) and disaster recovery (DR) publications, online discussions, etc. They have above-average knowledge of best practices and technology in BC/DR. While nonrandom, the survey is still a valuable tool in understanding where advanced users are today and where the industry is headed.
| |
 |
|
| |
(표 1-1) 재해복구 관련 예산 (연간)
|
|
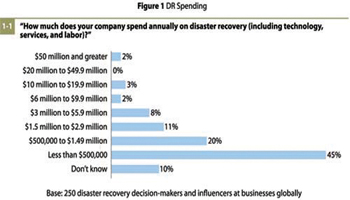
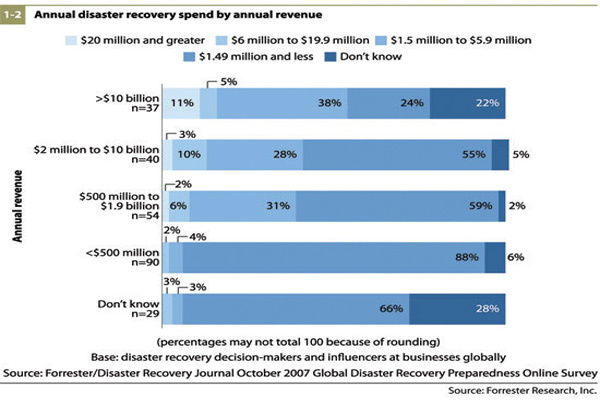
[표 1-1] 재해복구 관련 예산 (연간)에서 조사된 것과 같이 전체적으로 재해복구관련 예산집행 수준은 낮았으며, 연간 10억 이상의 예산을 확보하고 있는 기업이 전체 250개 기업의 응답 중 1/4에도 미치지 못하고 있다. 하지만 기업 소득수준이 높을수록 재해복구 관련 예산 규모도 증가하는 경향은 조사결과로 확인되었다. ([표 1-2] 참고)
Disaster Recovery Spending Increases With Company Revenue Overall, DR spending is low, according to our survey; 45 percent of respondents spend less than $500,000 annually on disaster recovery, and 20 percent spend between $500,000 and $1.49 million. Spending increases with company revenue, which isn’t surprising; the higher the company revenue, the more the company is willing to spend to protect revenue from probable causes of operational downtime (see Figure 1).
| |
 |
|
| |
(표 1-2) 소득대비 재해복구 예산 (연간)
|
|
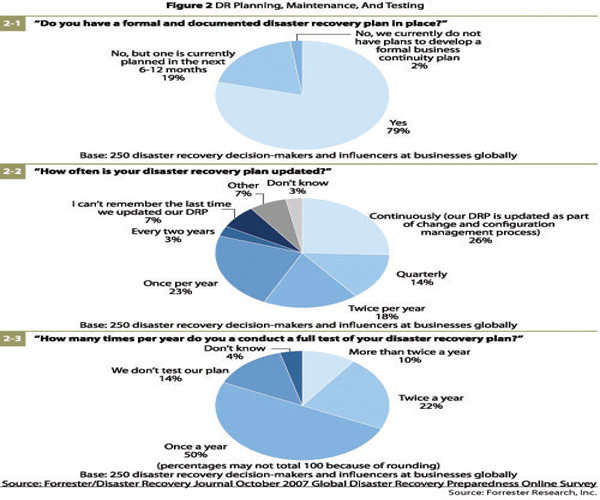
비즈니스연속성, 재해복구와 관련해서 가장 중요한 요소이면서 실제로 운영하기가 쉽지 않은 재해복구계획수립, 유지관리 및 테스트 활동과 관련해서, 20%가 넘는 기업들이 아직까지 계획을 보유하지 못하고 있거나 있더라도 주기적인 변경관리, 형상관리 등 유지관리가 되지 않고 있음은 물론이고 테스트로 인해 실행가능성과 완전성이 검토되고 있지 않은 것으로 조사되었다. 반면 재해복구계획을 보유하고 있는 기업은 절반이상이 1년에 2회 이상 주기적으로 업데이트를 하고 있으며, 테스트 역시 1년에 2회 이상 수행하는 기업이 32% 이상을 차지하였다. (자세한 조사결과는 [표 2] 참고)
Disaster Recovery Planning, Maintenance, And Testing Is Improving
1. Perhaps one of the biggest challenges to effective DR preparedness is planning, maintenance, and testing. Through client inquiries and advisories, Forrester finds that many companies don’t have formal plans in place, and if they do have plans, they aren’t integrated into regular configuration management and change management processes, and they are not regularly tested. According to Forrester’s Enterprise And SMB Hardware Survey, North America And Europe, Q3 2007, approximately 23 percent of enterprises (companies with more than 1,000 employees) never test their disaster recovery plans. By contrast, Forrester found in this survey that:
2. A majority of companies has formal DR plans in place. Approximately 79 percent of respondents already have formal DR plans in place, and another 19 percent plan to have formal DR plans in place in the next year.
3. Almost one-third of companies continuously update plans. The best practice in plan maintenance is to ensure that DR plans are continuously updated as part of configuration management and change management. Another 14 percent of respondents update their plans at least quarterly.
4. One-third of companies test their plans at least twice a year. Forrester recommends that companies conduct at least two full tests per year, followed by several component tests throughout the year. Fifty percent of companies still only test once a year, and 14 percent never test (see Figure 2).
| |
 |
|
| |
(표 2) 재해복구 계획수립(2-1), 유지관리(2-2) 및 테스트(2-3)
|
|
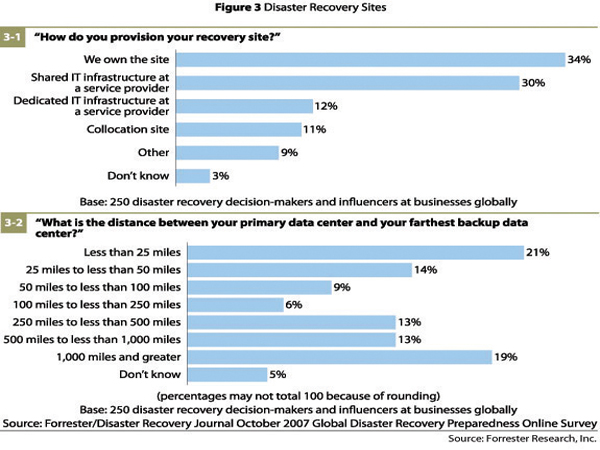
재해복구 인프라와 관련해서, 대체업무장소 또는 데이터 백업 및 재해복구시스템이 구축된 센터를 의미하는 복구사이트(recovery site)에 대해서는 재해복구 전용으로 기업에서 자체적으로 보유하고 있는 공간 및 시설을 선호하는 경향(34% 이상 응답)을 보여주고 있다. 주 전산센터와 백업센터간의 거리에 대해서는 어떤 지배적인 표준이나 기준이 있지는 않으나, 동일 재해영향권이 아니면서 비용과 목표복구수준 등을 고려하고 있으며, 조사결과로는 약 80km 이내의 거리간격을 두고 있는 경우가 35% 정도로 조사되었으며, 나머지 대부분 기업은 그 이상의 거리를 고려하여 복구사이트를 구축, 운영하고 있음을 알 수 있다. (자세한 조사결과는 [표 3] 참고)
Companies Prefer Dedicated IT Recovery Infrastructure, And Site Separation Is Increasing Companies clearly prefer dedicated infrastructure. According to our survey, 57 percent of respondents use dedicated IT infrastructure, whether that’s at an internal site (34 percent), collocation site (11 percent), or service provider site (12 percent). With dedicated infrastructure, companies can achieve a much better time to recovery and improve their recovery point with the use of replication (see Figure 3-1). There is no “rule of thumb” when it comes to the appropriate distance between your data center and your recovery site. You have to achieve enough distance between sites to escape the same set of threat events while balancing recovery requirements, technology limitations, and cost. We found that DRJ members favor greater distances than the enterprise decision-makers we surveyed. According to Forrester’s Enterprise And SMB Hardware Survey, North America And Europe, Q3 2007, approximately 48 percent of enterprises have sites less than 50 miles apart. By contrast, Forrester found that only 35 percent of DRJ members have sites less than 50 miles apart (see Figure 3-2).
| |
 |
|
| |
(표 3) 재해복구 사이트ㆍ구축여부(3-1), 주 데이터센터과 백업센터간 거리 수준(3-2)
|
|
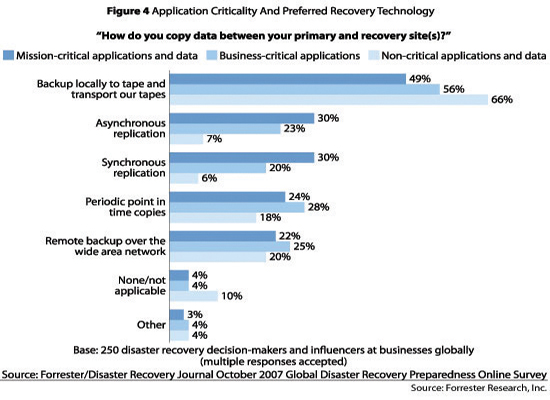
평균적으로 응용프로그램(application, 특정 업무처리를 위해 작성, 운영되는 프로그램) 중 35% 이상이 mission-critical(중단 없이 업무가 수행되어야 하는 핵심업무, 프로세스 또는 시스템을 의미)로 분류하고 있다고 응답하고 있으며, 이러한 핵심 응용프로그램에 대한 복구 기술로 전통적인 테이프 백업 방식이 아직도 지배적인 것으로 조사되었다. 그리고 데이터 백업방식인 복제(replication)의 대상 역시 mission-critical만이 아닌 business-critical한 응용프로그램에까지 확대되고 있다고 조사되었다.([표4] 참고)
More And More Applications Are Considered Critical
When asked to classify what percentage of applications fell into mission-critical, business-critical, and non-critical categories, it appears that companies are less likely to classify applications as non-critical. On average, respondents classified approximately 35 percent of applications and data as mission-critical, 37 percent as business-critical, and 28 percent as non-critical.
● Tape is still the dominant recovery technology. For all applications and data sets, regardless of criticality, tape still remains an important part of disaster recovery preparedness. This means that while the use of replication is increasing, companies will still perform traditional backups as a precaution and to ensure that they have a history of recovery points.
● Companies are expanding the use of replication. Replication is no longer used only for mission-critical applications. The survey indicates that companies use synchronous and asynchronous replication to protect business-critical applications (see Figure 4).
| |
 |
|
| |
(표 4) 응용프로그램 중요도(criticality) 대비 선호하는 복구관련 기술
|
|
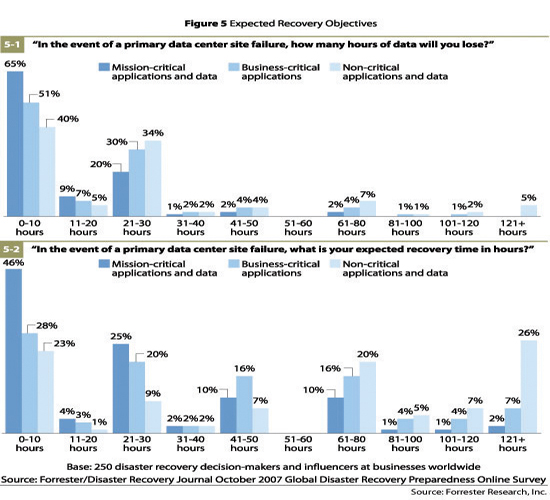
백업, 업무재개를 위한 복구사이트 구축의 증대로 목표복구시간/시점(RTO, RPO) 수준은 점점 짧아지고 있으며 65%의 기업은 핵심 데이터의 RTO가 10시간 미만으로 응답하고 있다. (자세한 조사결과는 [표 5] 목표복구수준 (시간/시점) 참고)
Companies Now Measure Their Expected Recovery In Hours With dedicated IT infrastructure at the recovery site and expanded use of replication, recovery time and recovery point objectives are now measured in hours. Sixty-five percent of respondents reported that they would lose less than 10 hours of mission-critical data and 46 percent reported that they could recover mission-critical applications in less than 10 hours (see Figure 5).
| |
 |
|
| |
(표 5) 목표복구수준 (시간/시점)
|
|
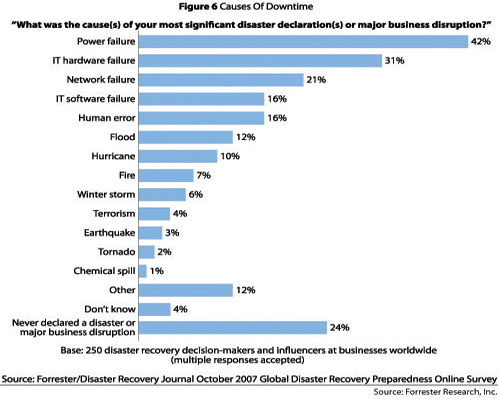
약 72%의 설문대상 조사기업이 지난 5년간 한번도 재해선포를 공식적으로 의사결정 내린 경험을 가지고 있지 않다고 응답하였다. 이를 기준으로 해석한다면 향후 5년 내에 약 28% 정도의 기업은 재해를 선포하고 대체복구사이트에서 업무를 복구, 재개할 가능성이 크다고 말할 수 있으며 사실 재해선포를 한적이 없다라는 답변에는 업무중단에 영향은 미치지만 그것이 전체 데이터센터에 영향을 미치지 않는 이벤트(사건, 사고) 상황은 고려하지 않은 것이기 때문에 그 확률은 더 높아질 수 있을 것이다. 한편 재해선포나 업무중단을 일으키는 가장 큰 원인으로 전력공급중단(power failure)을 들고 있으며(42%), 그 다음으로 시스템 장애(IT hardware failure) (31%)와 네트워크 장애(Network failure) (21%)를 주요 원인으로 꼽고 있다.
Most Declared Disasters And Disruptions Are Preventable
According to our survey, approximately 72 percent of companies have never officially “declared disaster” in the past five years. Companies should not take comfort in this statistic. It still means that almost 28 percent of companies are likely to “declare disaster” and failover to their alternate site in a five-year time period, and it doesn’t take into account the events that disrupt operations but don’t affect the entire data center. The survey also found that:
● The most common cause of declared disaster is power failures. Forty-two percent of respondents indicated that a power failure was the cause of their most significant disaster declaration or major business disruption, followed by IT hardware failures and network failures (see Figure 6).
● Most companies can recover operations in less than 10 hours after a declared disaster. Of the 190 respondents to our survey that have had to declare a disaster or suffered a major business disruption, 62 percent recovered operations in less than 10 hours.
● Most companies will lose less than 10 hours of data in a declared disaster. Of the 190 respondents to our survey that have had to declare a disaster or suffered a major business disruption, 83 percent lost less than 10 hours of data.
● 64 percent of companies don’t know the cost of their most recent declared disaster or disruption. So IT operations have improved planning, maintenance, testing, and actual response but still can’t actually measure the cost of a declared disaster. For the 12 percent of companies that do know their costs, the average total cost of a declared disaster is approximately $1.9 million.
| |
 |
|
| |
(표 6) IT 시스템중단(장애) 원인
|
|
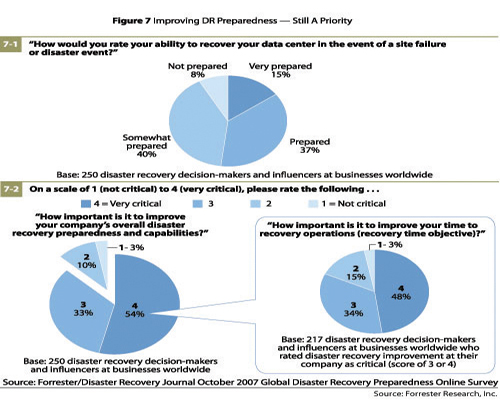
현재의 재해복구체계가 잘 준비되어 있다라고 응답자의 52% 이상이 자체평가를 하고 있는 것으로 파악되었으며, 한편 복구역량을 개선, 강화하는 것을 회사차원에서 매우 시급하고 중요(very critical)하다는 답변 역시 과반수 이상이 답변을 하여 아직 재해복구 역량 확보를 위한 조직 내의 성숙도 수준이 더 높아져야 하고 개선을 위한 노력을 지속적으로 경주해야 한다는 것을 말해주고 있다.
DR Preparedness, Companies Still Strive For Improvement Companies are confident about their current DR preparedness, and for those that have experienced disasters or disruptions, recovery capabilities are now measured in hours. But despite all these efforts, there is still a push to improve recovery capabilities even further (see Figure 7).
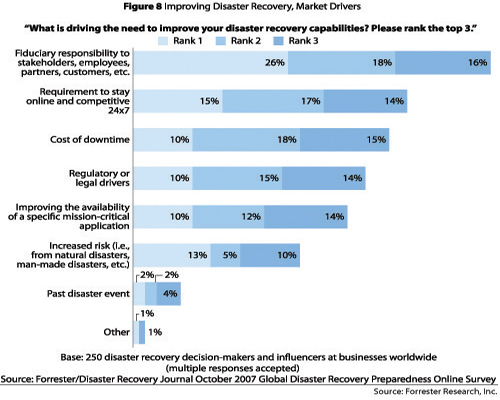
재해복구체계 개선의 동인으로 가장 많은 응답자들은 법률, 규제 책임을 들었으며, 중단없는 비즈니스연속성확보에 대한 이해관계자의 요구사항이 그 다음을, 그리고 비즈니스중단에 따른 손실비용(cost of downtime)이라고 답하였다.
| |
 |
|
| |
(표 7) 재해복구체계의 개선 재해복구수준의 자가평가(7-1), 중요성 인식(7-2)
|
|
마지막으로 설문조사 결과를 통해 재해복구체계 도입과 구축의 중요성과 더불어 그 대상 및 범위도 정보시스템 틀에서 벗어나 최고경영층의 주요 경영의제(CEO Agenda)로 확대되고 있다는 것을 다시 한번 확인하는 계기가 되었다.
When respondents were asked to identify what was driving their need to improve disaster recovery preparedness, fiduciary responsibility was ranked the highest, followed by the need stay online and competitive and the cost of downtime (see Figure 8). The survey results indicate that DR preparedness is gaining awareness and importance with constituents outside of IT; it’s now a priority with strategic senior executives, stakeholder, partners, and customers.
| |
 |
|
| |
(표 8) 재해복구체계 도입, 개선의 동인(driver)
|
|
기고자 : 스테파니 바라우라스, 포레스터 리서치 선임조사역
About The Author Stephanie Balaouras is a senior analyst for Forrester Research. Balaouras primarily contributes to Forrester's offerings for IT infrastructure and operations professionals. She is a leading expert in how companies build resilient IT infrastructures to support key business initiatives. Balaouras has more than 10 years experience with technology for information storage, information protection, and disaster recovery. Balaouras holds a bachelor's degree in business administration and finance and investments from Babson College.
번역 : 유종기, 영국 Business Continuity Institute (www.thebci.org) 한국대표 |


 marketing@di-focus.com